المدينة
Dubai
النوع
مجمع متعدد الاستخدامات
الموقع
مستوى البناء
Fully Developed
متوسط العائد الإيجاري
7.2%
نمط الحياة
Family-FriendlyBusy
عن المنطقة Motor City
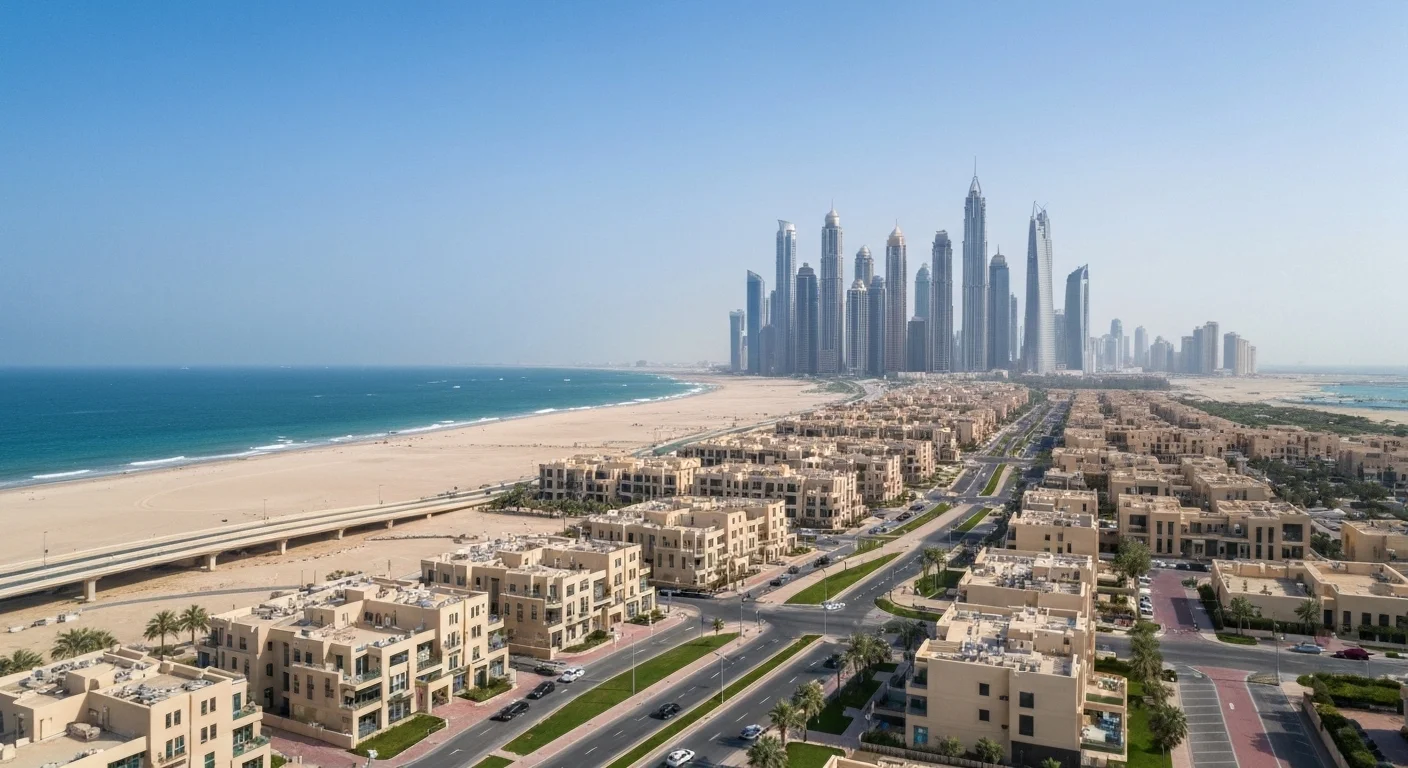
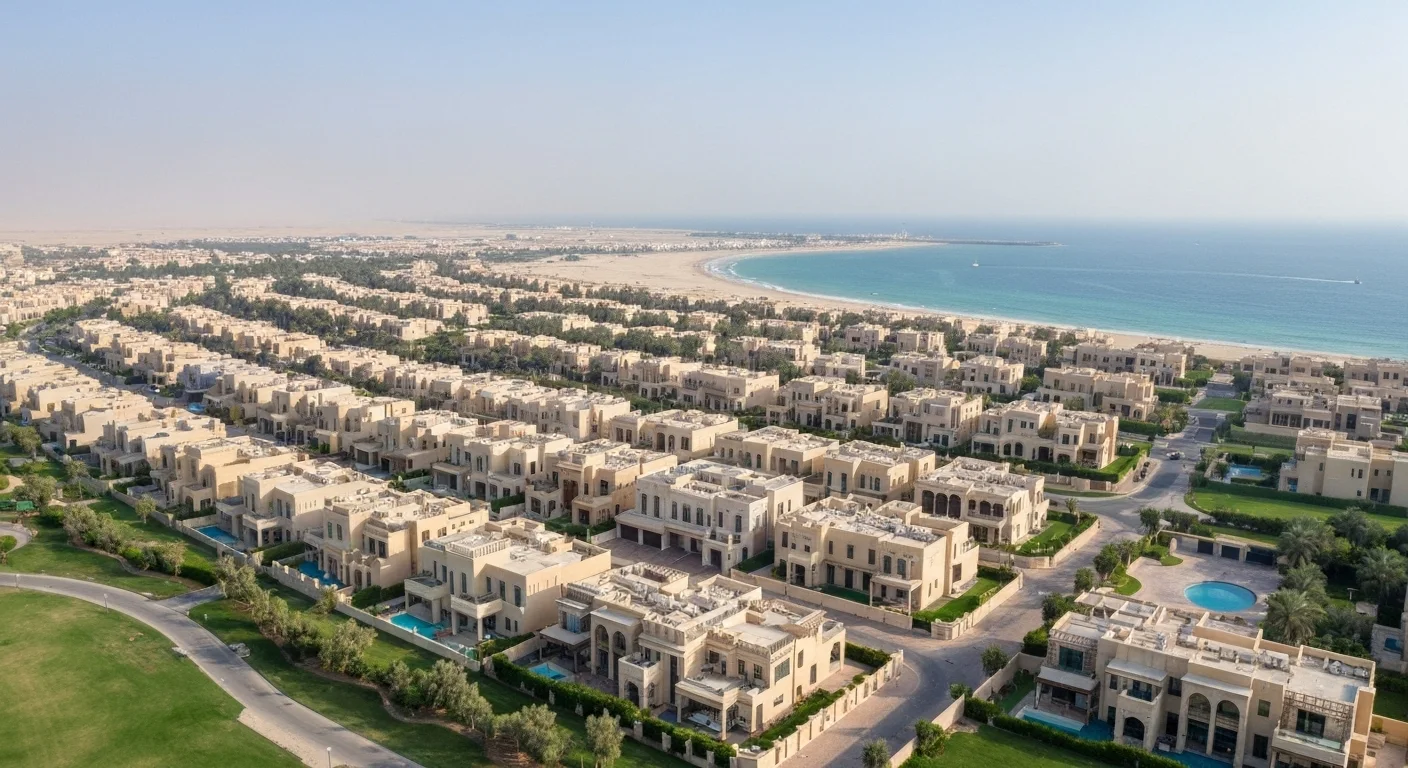
مدينة السيارات هي مشروع تطوير فريد ومبتكر في دبي يجمع بين خيارات الترفيه والطعام والتجزئة مع مجموعة من الوحدات السكنية. تم تصميم المنطقة لتشبه نسخة مصغرة من ديترويت، مع عناصر مستوحاة من مدينة السيارات في جميع أنحاء المجتمع. يمكن للسكان والزوار الاستمتاع بأجواء دبي أوتودروم المثيرة التي تستضيف العديد من فعاليات سباقات السيارات على مدار العام.
نظرة عامة على المجمع Motor City
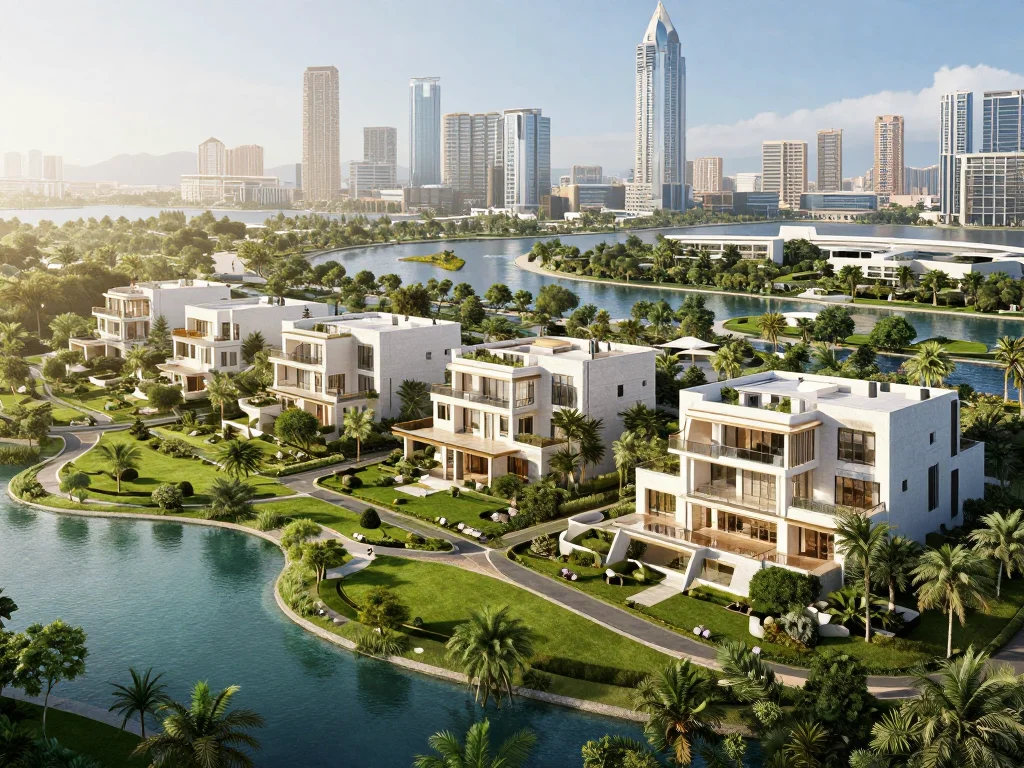
مدينة موتور هي مجتمع مستقل يقدم مجموعة من المرافق، بما في ذلك الحدائق، وملاعب الأطفال، وبحيرة. المنطقة تحظى بشعبية بين العائلات والمهنيين الشباب الذين يبحثون عن مكان فريد ومثير للعيش.
نظرة عامة على العقارات Motor City
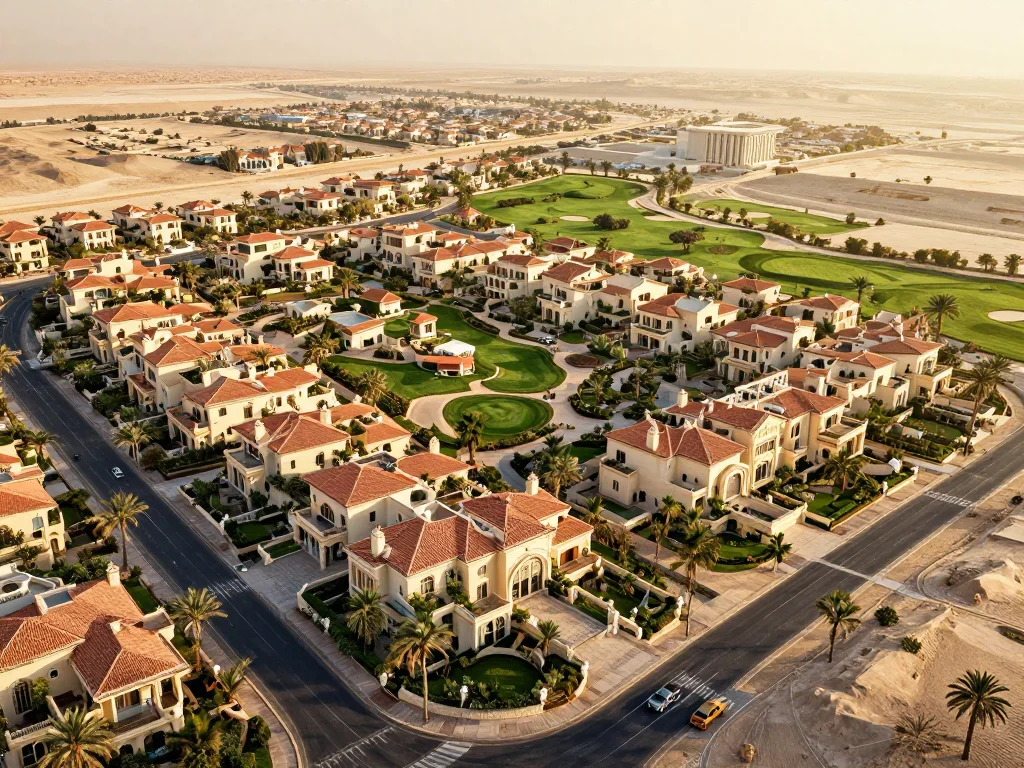
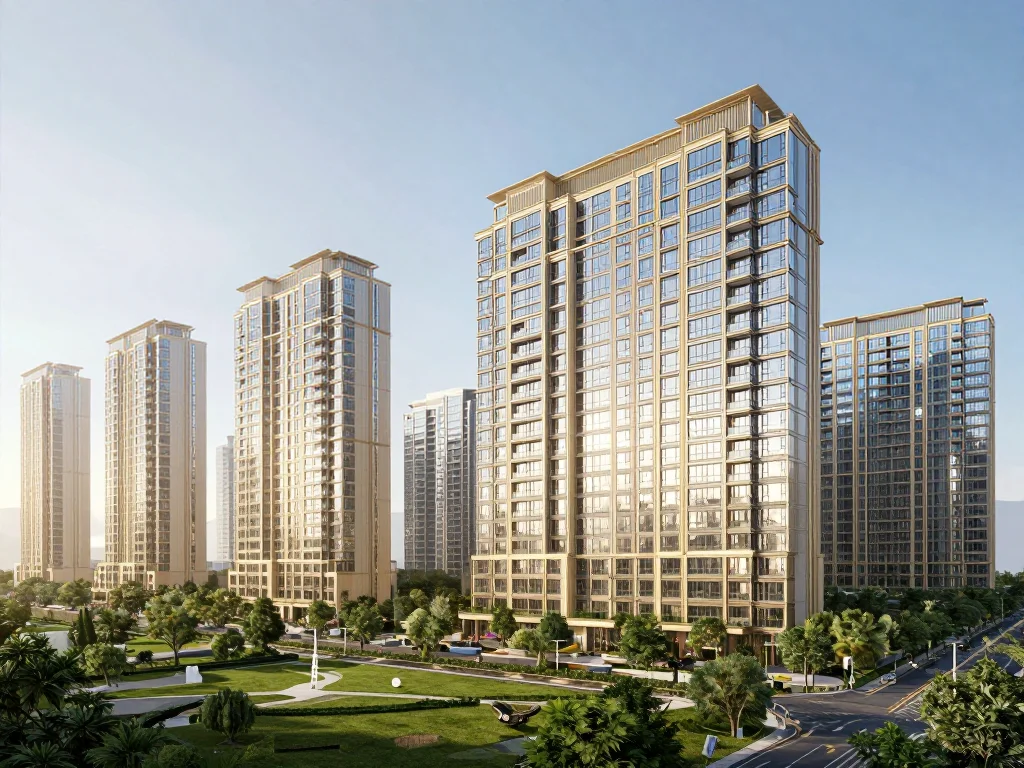
تتراوح العقارات في مدينة موتور بين الاستوديوهات الأنيقة إلى شقق واسعة بثلاث غرف نوم، وتوفر مجموعة من الخيارات للمشترين والمستأجرين. تم تصميم العديد من العقارات بطابع مستقبلي وحديث، مما يعكس تركيز المنطقة على الابتكار والتكنولوجيا.
نمط الحياة والمرافق Motor City
أسلوب الحياة في مدينة موتور سريع الإيقاع ومثير، مع مجموعة من الأنشطة والفعاليات للاستمتاع بها. يمكن للسكان المشاركة في فعاليات سباقات السيارات، أو زيارة القرية العالمية القريبة، أو ببساطة الاستمتاع بالعديد من المطاعم والمقاهي في المنطقة.
المواصلات Motor City
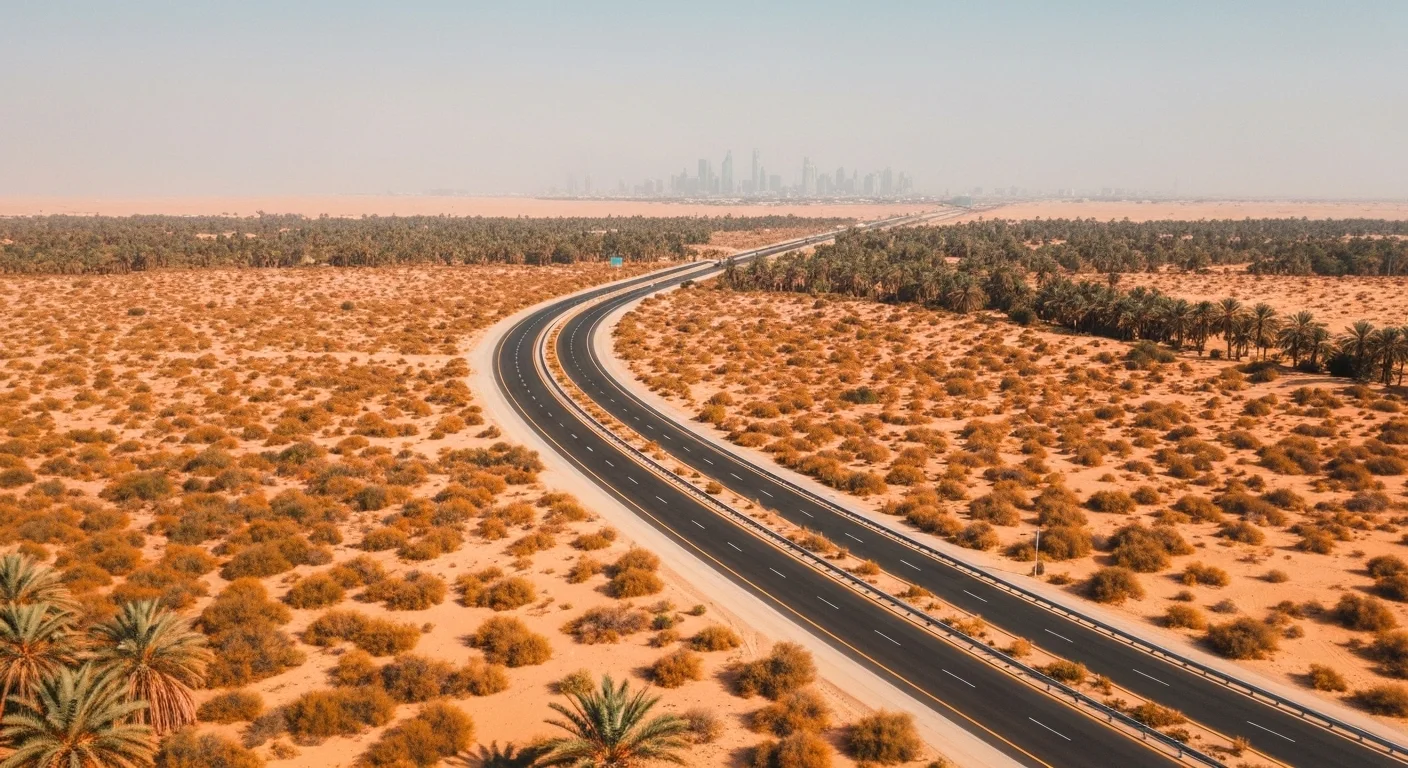
تقع مدينة السيارات بالقرب من طريق الإمارات وطريق الشيخ محمد بن زايد، مما يجعلها سهلة الوصول بالسيارة. المنطقة أيضا قريبة من مترو دبي، حيث تربط عدة خطوط حافلات المجتمع بأجزاء أخرى من المدينة.
المرافق Motor City
تقدم مدينة موتور مجموعة من المرافق، بما في ذلك مجموعة متنوعة من المطاعم والمقاهي والمتاجر. كما تضم المنطقة حلبة دبي أوتودروم، التي تستضيف العديد من فعاليات سباقات السيارات على مدار العام. تشمل المرافق الأخرى مسجدا ومدرسة وعدة حدائق وملاعب.
المواقع القريبة Motor City
تقع مدينة السيارات بالقرب من عدة مناطق شهيرة، منها مدينة الرياضة، ومدينة الاستوديو، ومزارع أرانشيز. المنطقة أيضا قريبة من منتزه دبي للاستثمار ومنطقة جبل علي الحرة، مما يجعلها خيارا شائعا للمهنيين في مجال الأعمال.
أمور يجب مراعاتها Motor City
أحد الأمور التي يجب أخذها في الاعتبار عند العيش في مدينة السيارات هو مستوى الضوضاء، حيث تقع المنطقة بالقرب من دبي. بالإضافة إلى ذلك، لا يزال المجتمع في طور التطور، وقد لا تتوفر بعض المرافق بعد.
المدارس في Motor City
View all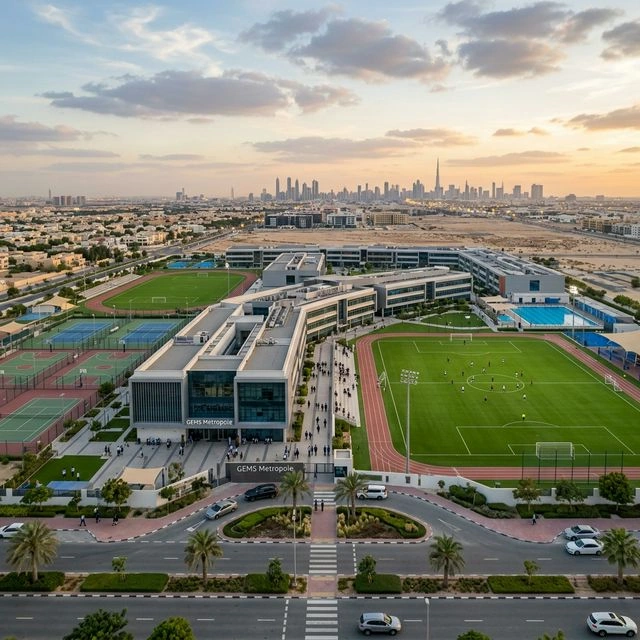
Frequently Asked Questions about Motor City
What is Motor City known for?
Motor City is a vibrant community in Dubai known for its excellent infrastructure, convenient location, and diverse range of amenities. Residents enjoy easy access to major roads, public transport, shopping centers, and recreational facilities.
Are there schools near Motor City?
Yes, Motor City is well-served by numerous schools and educational institutions, ranging from international curriculum schools to local academies, making it an ideal location for families.
What is the average rent in Motor City?
Rental prices in Motor City vary depending on the property type and size. The area offers a range of options from affordable apartments to premium villas, catering to various budgets.
Is Motor City a good investment?
Yes, Motor City continues to be a sought-after area with strong rental demand and capital appreciation potential, making it an attractive investment opportunity in Dubai's real estate market.
What transport options are available in Motor City?
Motor City offers excellent connectivity with proximity to major highways, metro stations, and bus routes. Residents can easily commute to key areas of Dubai.
خريطة الموقع
Loading map...
Community Guide
Live in
Motor City?
اعثر على منزلك المثالي في Motor City. تصفح قوائم حصرية للبيع والإيجار.
Market Research
Deep Dive into
Motor City Data
View price trends, transaction volumes, rental yields, property type distribution, and interactive maps sourced from DLD and Ejari.
View Full Research Reportأحدث العقارات في Motor City
عرض الكلExplore Nearby Areas
Discover popular communities and neighborhoods within easy reach of Motor City.
Explore More
Have a Property in Motor City?
Post your listing and reach thousands of potential buyers and renters
Post Free AdCompare Motor City
See how Motor City stacks up against other Dubai neighborhoods
Sports City
vs Motor City
Compare →
Arabian Ranches
vs Motor City
Compare →
Damac Hills
vs Motor City
Compare →
Dubai Hills
vs Motor City
Compare →
Disclaimer: Area information is provided for general guidance only and does not constitute professional property advice. Transaction data, rental yields, and market trends may change. Always verify current information directly with relevant authorities and professionals before making property decisions.
Updated N/A
Reviewed by BuyOrSell24 Research Team