المدينة
Dubai
النوع
مجمع متعدد الاستخدامات
الموقع
مستوى البناء
Fully Developed
متوسط العائد الإيجاري
7.5%
نمط الحياة
High-End
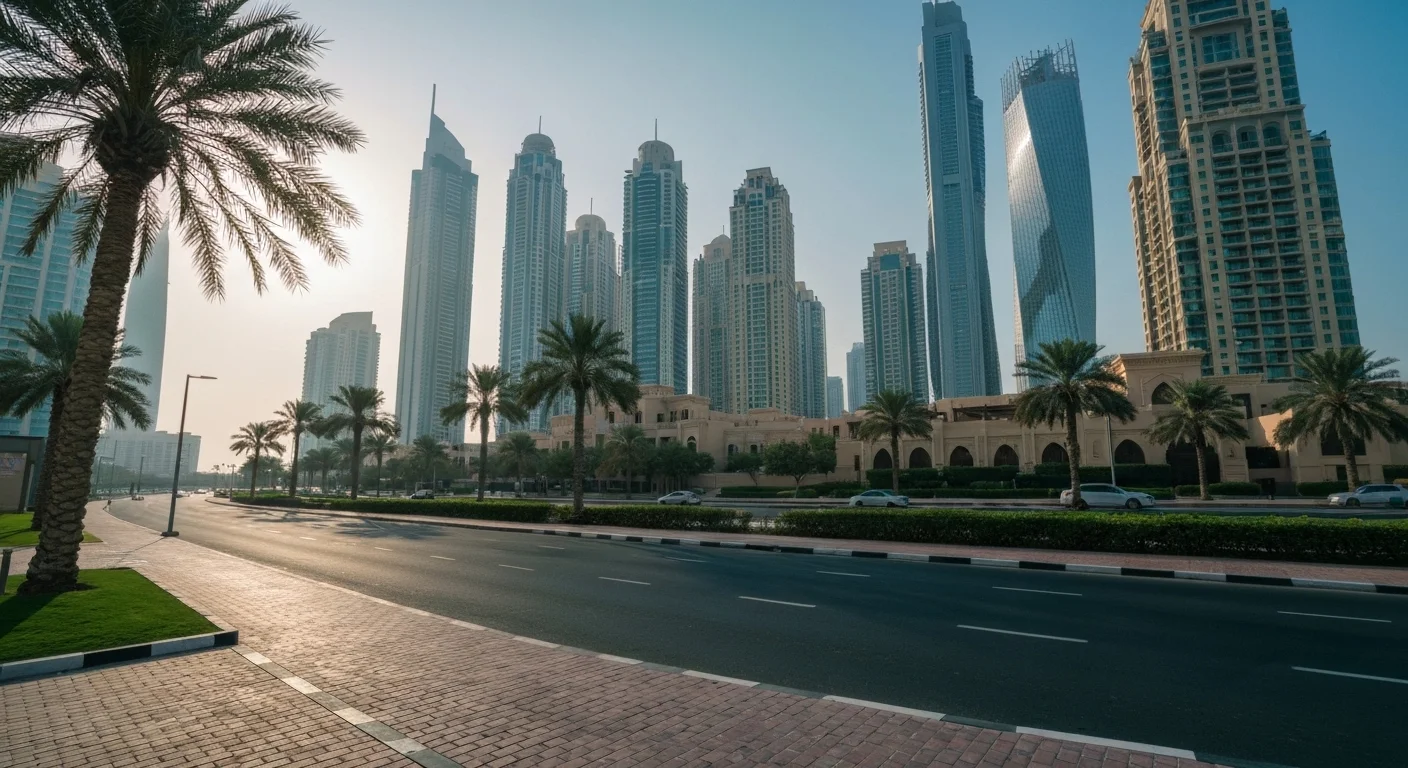
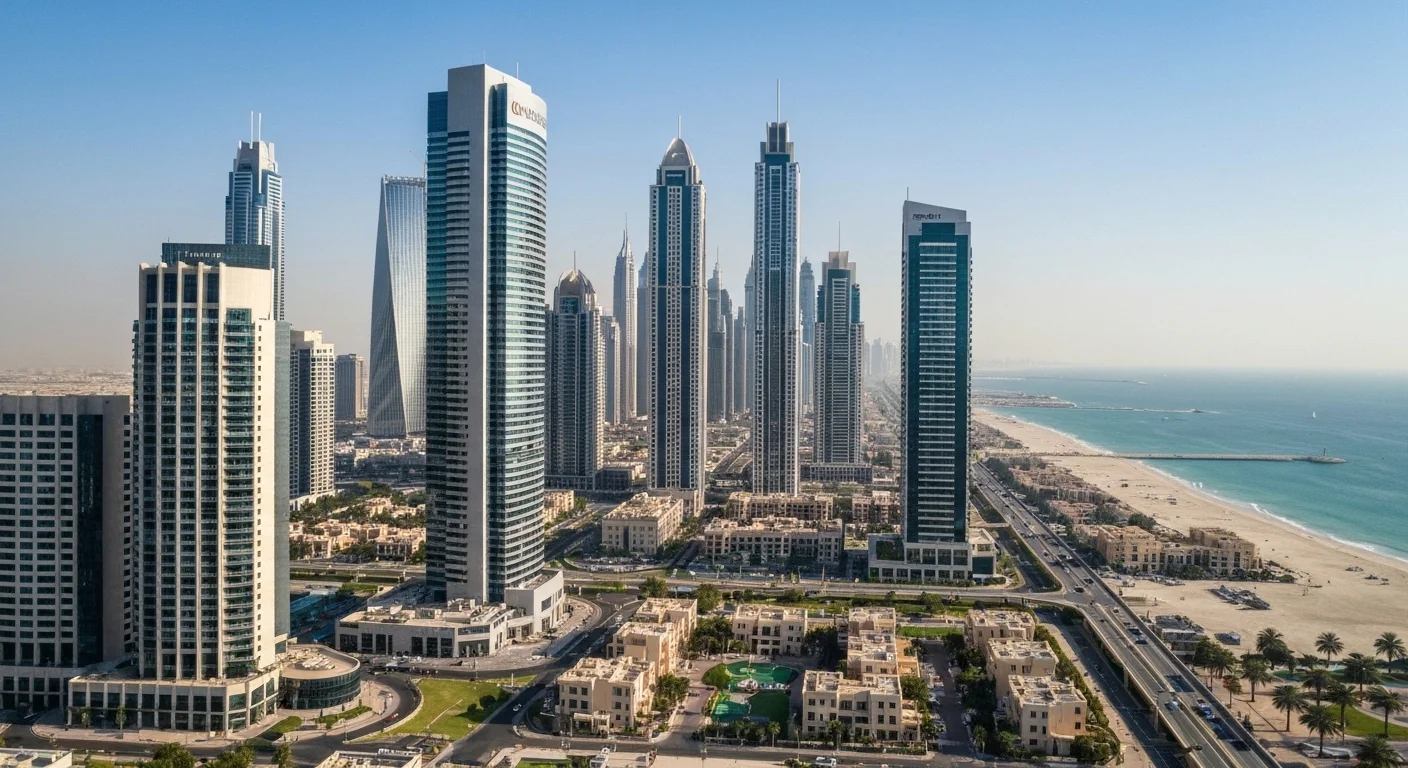
عن المنطقة Jumeirah
جميرا حي مرموق ومطلوب في دبي، معروف بشواطئها الخلابة، وفيلاتها الفاخرة، وأسلوب حياتها الراقي. تنقسم المنطقة إلى ثلاثة أقسام رئيسية: جميرا 1، جميرا 2، وجميرا 3، وكل منها يقدم مزيجا فريدا من المرافق التقليدية والحديثة. من شواطئها النقية إلى خيارات الطعام والترفيه العالمية، تقدم جميرا ما تقدمه للجميع.
نظرة عامة على المجمع Jumeirah
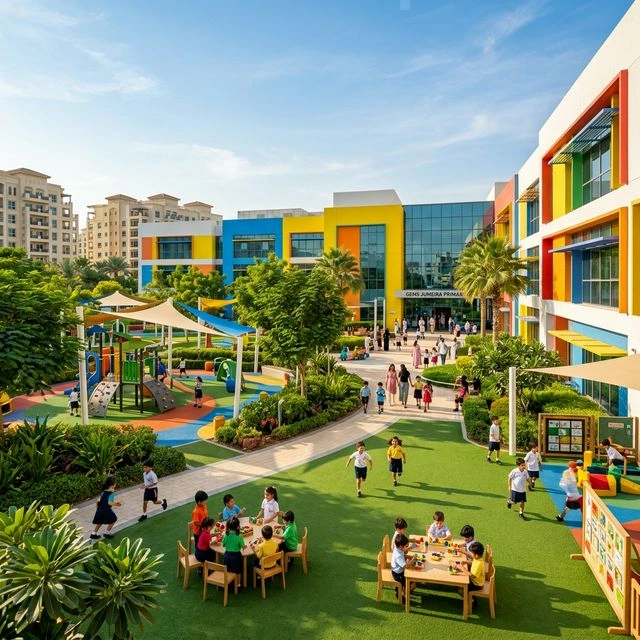
جميرا مجتمع نابض بالحياة ومتنوع، حيث يعيش مزيجا من السكان المحليين والمغتربين في المنطقة. يشتهر الحي بروح المجتمع القوية، حيث يشارك العديد من السكان بنشاط في الفعاليات والأنشطة المحلية. تضم المنطقة أيضا عدة مدارس دولية، مما يجعلها خيارا شائعا للعائلات.
نظرة عامة على العقارات Jumeirah
تقدم جميرا مجموعة واسعة من العقارات، من الفيلات الفاخرة إلى الشقق الحديثة. تضم المنطقة بعضا من أشهر وأشهر مشاريع تطوير دبي المطلوبة، بما في ذلك منزل شاطئ جميرا وفندق بالم جميرا. سواء كنت تبحث عن استوديو دافئ أو فيلا واسعة، فإن جميرا تقدم ما يناسب كل ذوق وميزانية.
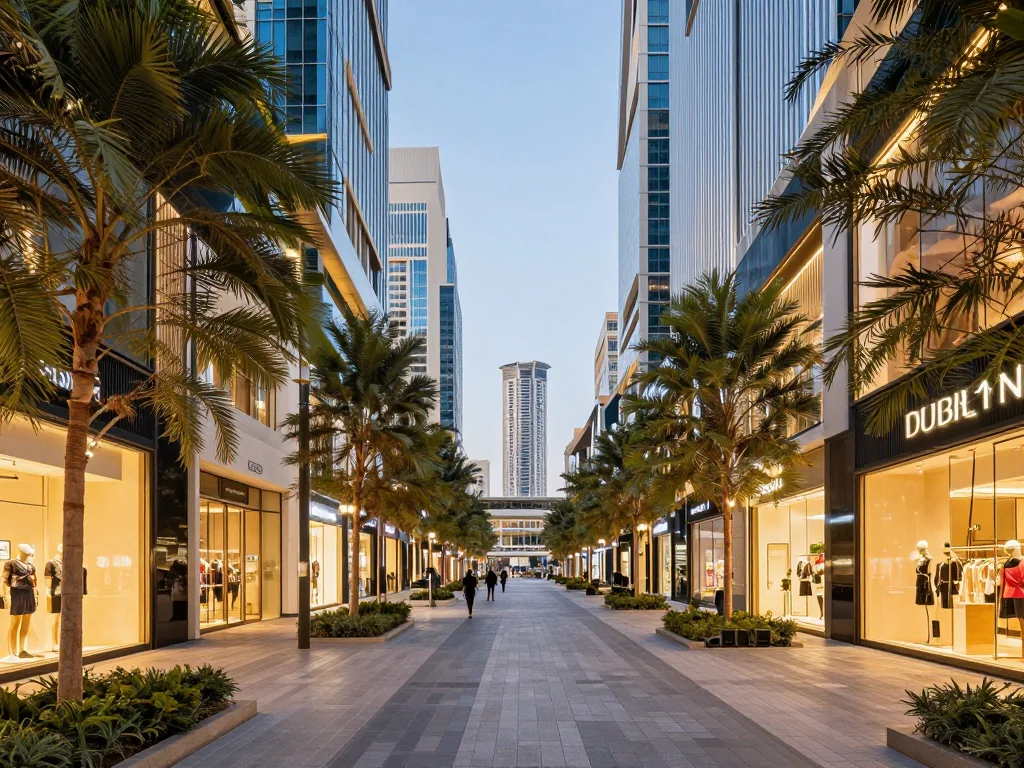
نمط الحياة والمرافق Jumeirah
جميرا خيار شائع لأولئك الذين يرغبون في تجربة أفضل ما في أسلوب حياة دبي الفاخر. تشتهر المنطقة بخيارات التسوق وتناول الطعام الفاخرة، بالإضافة إلى حياتها الليلية النابضة بالحياة. من شواطئها النقية إلى مرافقها العالمية المستوى، تعد جميرا المكان المثالي للعيش والعمل والاستمتاع.
المواصلات Jumeirah
جميرا متصلة جيدا ببقية دبي، حيث تمر العديد من الطرق والطرق السريعة الرئيسية عبر المنطقة. يخدم الحي أيضا عدد من خطوط الحافلات وخدمات سيارات الأجرة، مما يسهل التنقل بدون سيارة. لمن يفضلون القيادة، فإن مواقف السيارات وفيرة ومريحة.
المرافق Jumeirah
تضم جميرا مجموعة واسعة من المرافق، بما في ذلك مراكز تسوق عالمية المستوى، ومطاعم، وأماكن ترفيهية. تضم المنطقة أيضا عدة حدائق ومساحات خضراء، بما في ذلك منتزه شاطئ جميرا الشهير. لمن يحبون الرياضات المائية، تقدم المنطقة مجموعة من الأنشطة، بما في ذلك ركوب الأمواج، والتجديف، وركوب الألواح على الألواح المائية.
المواقع القريبة Jumeirah
تقع جميرا على ساحل دبي، على بعد حوالي 15 كيلومترا جنوب مركز المدينة. يحد المنطقة من الجنوب مرسى دبي وحي ساتوا من الشمال. أقرب محطة مترو هي محطة أبراج جميرا، التي يخدمها الخط الأحمر لمترو دبي.
أمور يجب مراعاتها Jumeirah
عند التفكير في الانتقال إلى جميرا، هناك عدة أمور يجب أخذها في الاعتبار. تشتهر المنطقة بارتفاع تكاليف المعيشة، لذا من الضروري وضع ميزانية دقيقة. بالإضافة إلى ذلك، قد تكون حركة المرور في المنطقة كثيفة، خاصة خلال ساعات الذروة. ومع ذلك، لمن يرغب في تجاوز هذه العيوب البسيطة، تقدم جميرا أسلوب حياة فريد وفريد من نوعه.
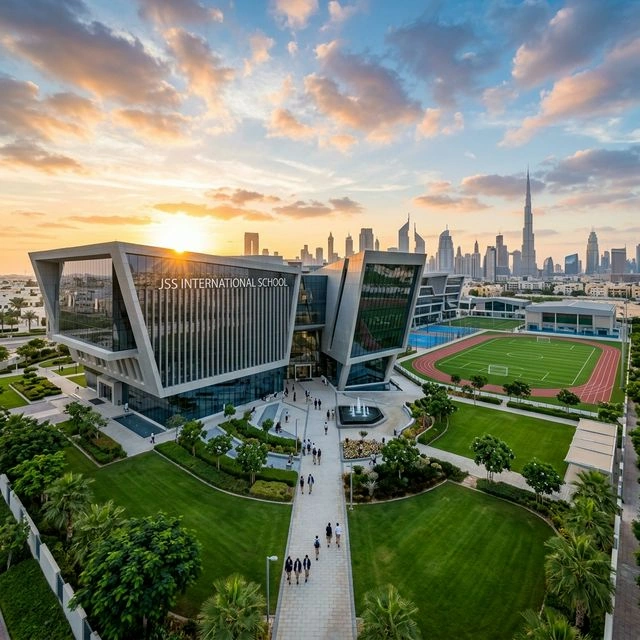
المدارس في Jumeirah
View all

Frequently Asked Questions about Jumeirah
What is Jumeirah known for?
Jumeirah is a vibrant community in Dubai known for its excellent infrastructure, convenient location, and diverse range of amenities. Residents enjoy easy access to major roads, public transport, shopping centers, and recreational facilities.
Are there schools near Jumeirah?
Yes, Jumeirah is well-served by numerous schools and educational institutions, ranging from international curriculum schools to local academies, making it an ideal location for families.
What is the average rent in Jumeirah?
Rental prices in Jumeirah vary depending on the property type and size. The area offers a range of options from affordable apartments to premium villas, catering to various budgets.
Is Jumeirah a good investment?
Yes, Jumeirah continues to be a sought-after area with strong rental demand and capital appreciation potential, making it an attractive investment opportunity in Dubai's real estate market.
What transport options are available in Jumeirah?
Jumeirah offers excellent connectivity with proximity to major highways, metro stations, and bus routes. Residents can easily commute to key areas of Dubai.
خريطة الموقع
Loading map...
Community Guide
Live in
Jumeirah?
اعثر على منزلك المثالي في Jumeirah. تصفح قوائم حصرية للبيع والإيجار.
Market Research
Deep Dive into
Jumeirah Data
View price trends, transaction volumes, rental yields, property type distribution, and interactive maps sourced from DLD and Ejari.
View Full Research Reportأحدث العقارات في Jumeirah
عرض الكلExplore Nearby Areas
Discover popular communities and neighborhoods within easy reach of Jumeirah.
0.5 km
DIFC
Explore community guide
0.9 km
Downtown Dubai
Avg. Rent (1BR)AED 85,000
1.2 km
City Walk
Explore community guide

3.1 km
Business Bay
Avg. Rent (1BR)AED 95,000
4.5 km
Satwa
Avg. Rent (1BR)AED 60,000
5.1 km
Karama
Avg. Rent (1BR)AED 70,000
6.0 km
Bur Dubai
Explore community guide

6.8 km
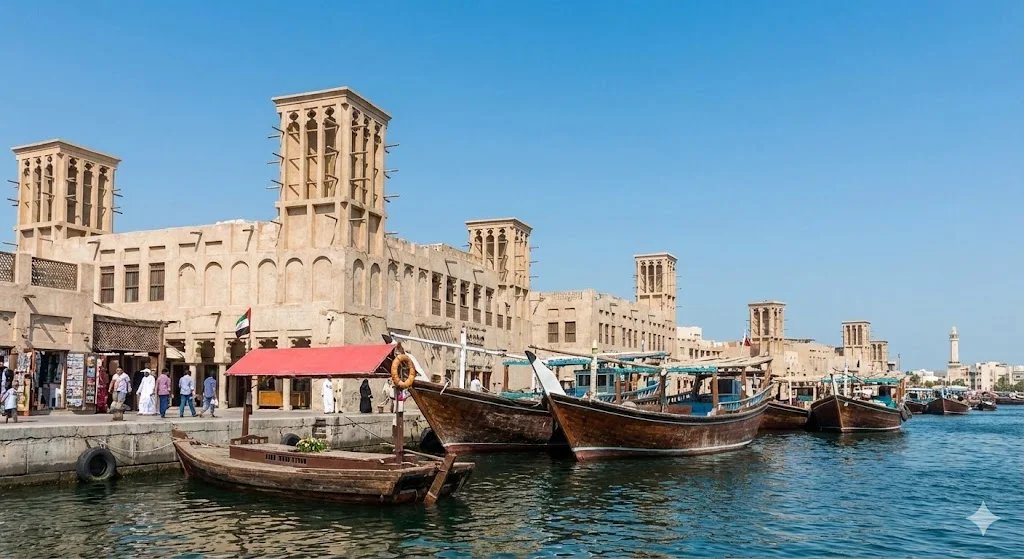
Deira
Explore community guide
Explore More
Have a Property in Jumeirah?
Post your listing and reach thousands of potential buyers and renters
Post Free AdCompare Jumeirah
See how Jumeirah stacks up against other Dubai neighborhoods
View all area comparisons →Disclaimer: Area information is provided for general guidance only and does not constitute professional property advice. Transaction data, rental yields, and market trends may change. Always verify current information directly with relevant authorities and professionals before making property decisions.
Updated N/A
Reviewed by BuyOrSell24 Research Team